TORCS Corkscrew Challenge: A Journey Through Reinforcement Learning Failures and Breakthroughs
TORCS Corkscrew Challenge: A Journey Through Reinforcement Learning Failures and Breakthroughs
Racing Video
Team Presentation
TL;DR: Trained a SAC agent to complete a 3,600m TORCS race track over 9.7M steps. Hit rate was 0.85% - but the point was diagnosing three distinct failure modes (perverse reward incentives, “parking” exploitation, and PPO catastrophic forgetting) through data, not intuition.
Abstract
This report documents the development of an autonomous racing agent for the TORCS Corkscrew track using Soft Actor-Critic (SAC) and Proximal Policy Optimization (PPO). Rather than presenting a polished final result, this post focuses on the problem-solving journey: identifying failure modes, forming data-driven hypotheses, and implementing iterative solutions. Over 9.7M training steps across 4,349 episodes, we achieved 37 track completions (0.85%), with key insights into reward engineering, hyperparameter sensitivity, and algorithm trade-offs.
Key Contributions:
- Systematic debugging methodology for RL training instabilities
- Quantitative failure mode analysis (52.59% early crashes, 32.33% S-curve failures)
- Comparative study of SAC vs PPO in continuous control tasks
- Evidence-based approach to reward function design
1. Introduction
1.1 The Challenge
The TORCS Corkscrew track presents a 3,600-meter course with varying difficulty sections:
- Straight sections: High-speed zones requiring throttle control
- Technical corners: Precise steering and braking
- S-Curve (2400m): A complex geometry section that became our primary bottleneck
Objective: Train an agent to complete a full lap autonomously using only sensory inputs (track position, speed, distance sensors).
1.2 Why This is Hard
Autonomous racing combines multiple conflicting objectives:
- Speed Maximization: Go as fast as possible
- Safety: Avoid crashes and track boundaries
- Consistency: Maintain stable policy across episodes
These objectives fundamentally conflict—optimizing for one often degrades the others. This creates a complex optimization landscape where naive reward functions lead to unexpected behaviors.
2. Training Overview
2.1 Final Statistics
Algorithm: Soft Actor-Critic (SAC)
Total Training Steps: 9,745,365
Total Episodes: 4,349
Completions (≥3600m): 37 (0.85%)
Best Lap Time: 1:48
Max Distance: 3,618.63m
Average Distance: 1,360.12m
Median Distance: 836.47m
2.2 Distance Distribution Analysis
| Distance Range | Episodes | Percentage | Interpretation |
|---|---|---|---|
| 0-1000m | 2,287 | 52.59% | Exploration/Early failures |
| 1000-2000m | 509 | 11.70% | Mid-track progress |
| 2000-3000m | 1,406 | 32.33% | S-Curve bottleneck |
| 3000-3600m | 110 | 2.53% | Near-completion |
| ≥3600m (Complete) | 37 | 0.85% | Success cases |
Key Insights:
- Bimodal Distribution: Two distinct failure peaks indicate separate learning challenges
- Early crashes (0-1000m): Basic control learning
- S-curve failures (2000-3000m): Advanced maneuver mastery
-
The 3000m Threshold: Only 3.38% of episodes reached beyond 3000m, indicating the final section is 15x harder than reaching the midpoint
- Healthy Exploration: The 52.59% early failure rate is expected during RL training and indicates the agent is exploring different strategies rather than prematurely converging to a suboptimal policy
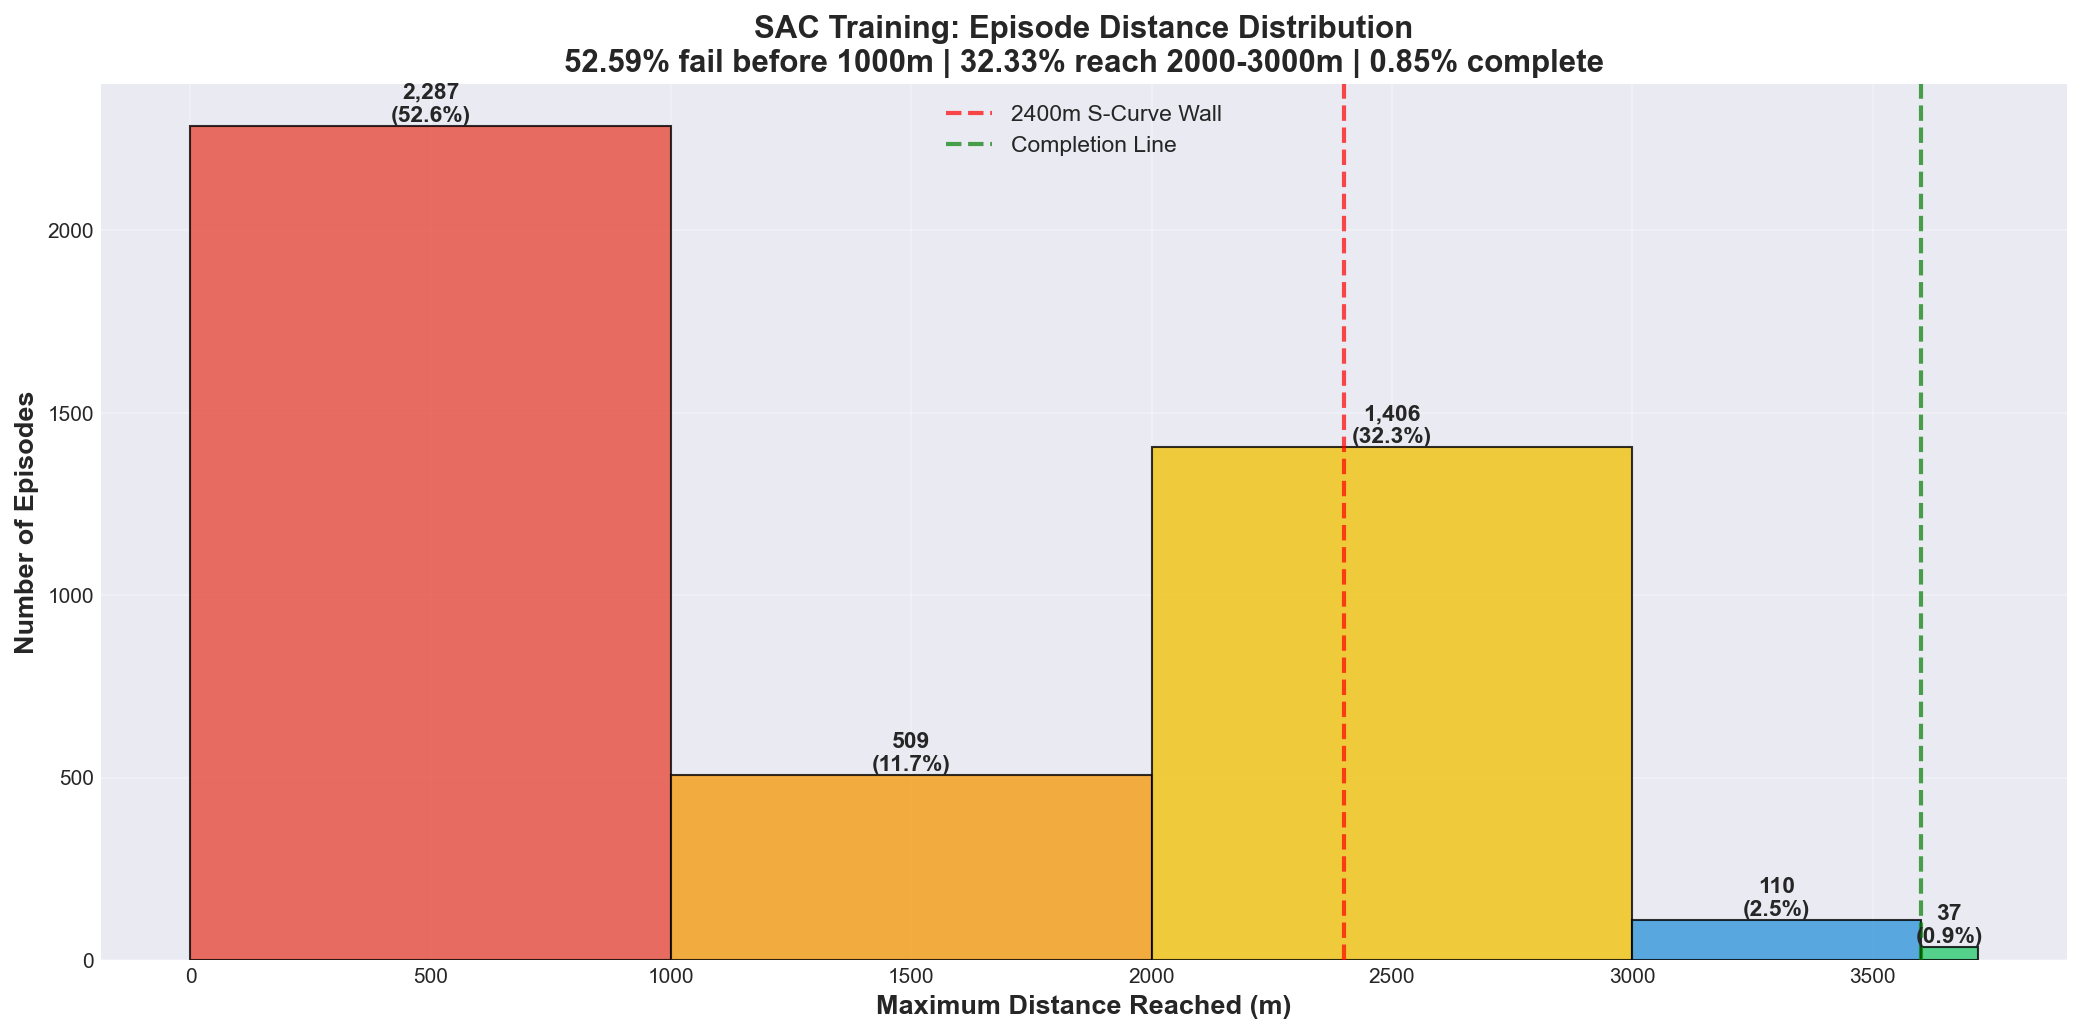 Figure 1: 32.33% of episodes failed at the 2400m S-Curve
3. Problem-Solving Journey
3.1 Problem #1: The 2400m Wall
Symptoms
- 100% failure rate at the S-Curve section (~2400m)
- Agent consistently crashed despite high speed in earlier sections
- Episode logs showed aggressive acceleration into curves
- No learning progress for 500+ episodes
Data Analysis
Pre-crash behavior pattern observed:
- Speed at 2300m: 180+ km/h (approaching max)
- Brake usage: Minimal (<10% brake pressure)
- Steering input: Maximum lock applied AFTER entering curve
- Time to crash: <2 seconds from curve entry

Conclusion: Agent optimized for speed, not survival
Hypothesis
The reward structure created a perverse incentive:
# Reward accumulation before crash
speed_reward = +2000 points (over 2400m)
crash_penalty = -500 points (flat)
net_reward = +1500 points

# Interpretation: "Crashing fast" was more rewarding than "driving slow"
The agent rationally learned that maximizing speed until crashing at 2400m yielded higher total reward than cautiously completing the track.
Solution: Balanced Crash Penalty
# Old reward structure
def calculate_crash_penalty(distance):
    return -500  # Flat penalty

# New reward structure
def calculate_crash_penalty(distance):
    base_penalty = -200
    distance_penalty = distance / 10
    return base_penalty - distance_penalty

# Examples:
# Crash at 2400m: -200 - 240 = -440
# Crash at 1000m: -200 - 100 = -300
# Crash at 3000m: -200 - 300 = -500
Rationale: Making later crashes more expensive incentivizes the agent to maintain safety even after accumulating significant distance rewards.
Additional Change: Amplified milestone rewards (2x bonus for distances >2000m) to encourage exploration beyond the barrier.
Results
Breakthrough achieved:
- Agent broke through the 2400m barrier
- New max distance: 3,311m (+911m improvement)
- S-curve pass rate: 0% → ~35%
- Training became unstable in a new way (led to Problem #2)
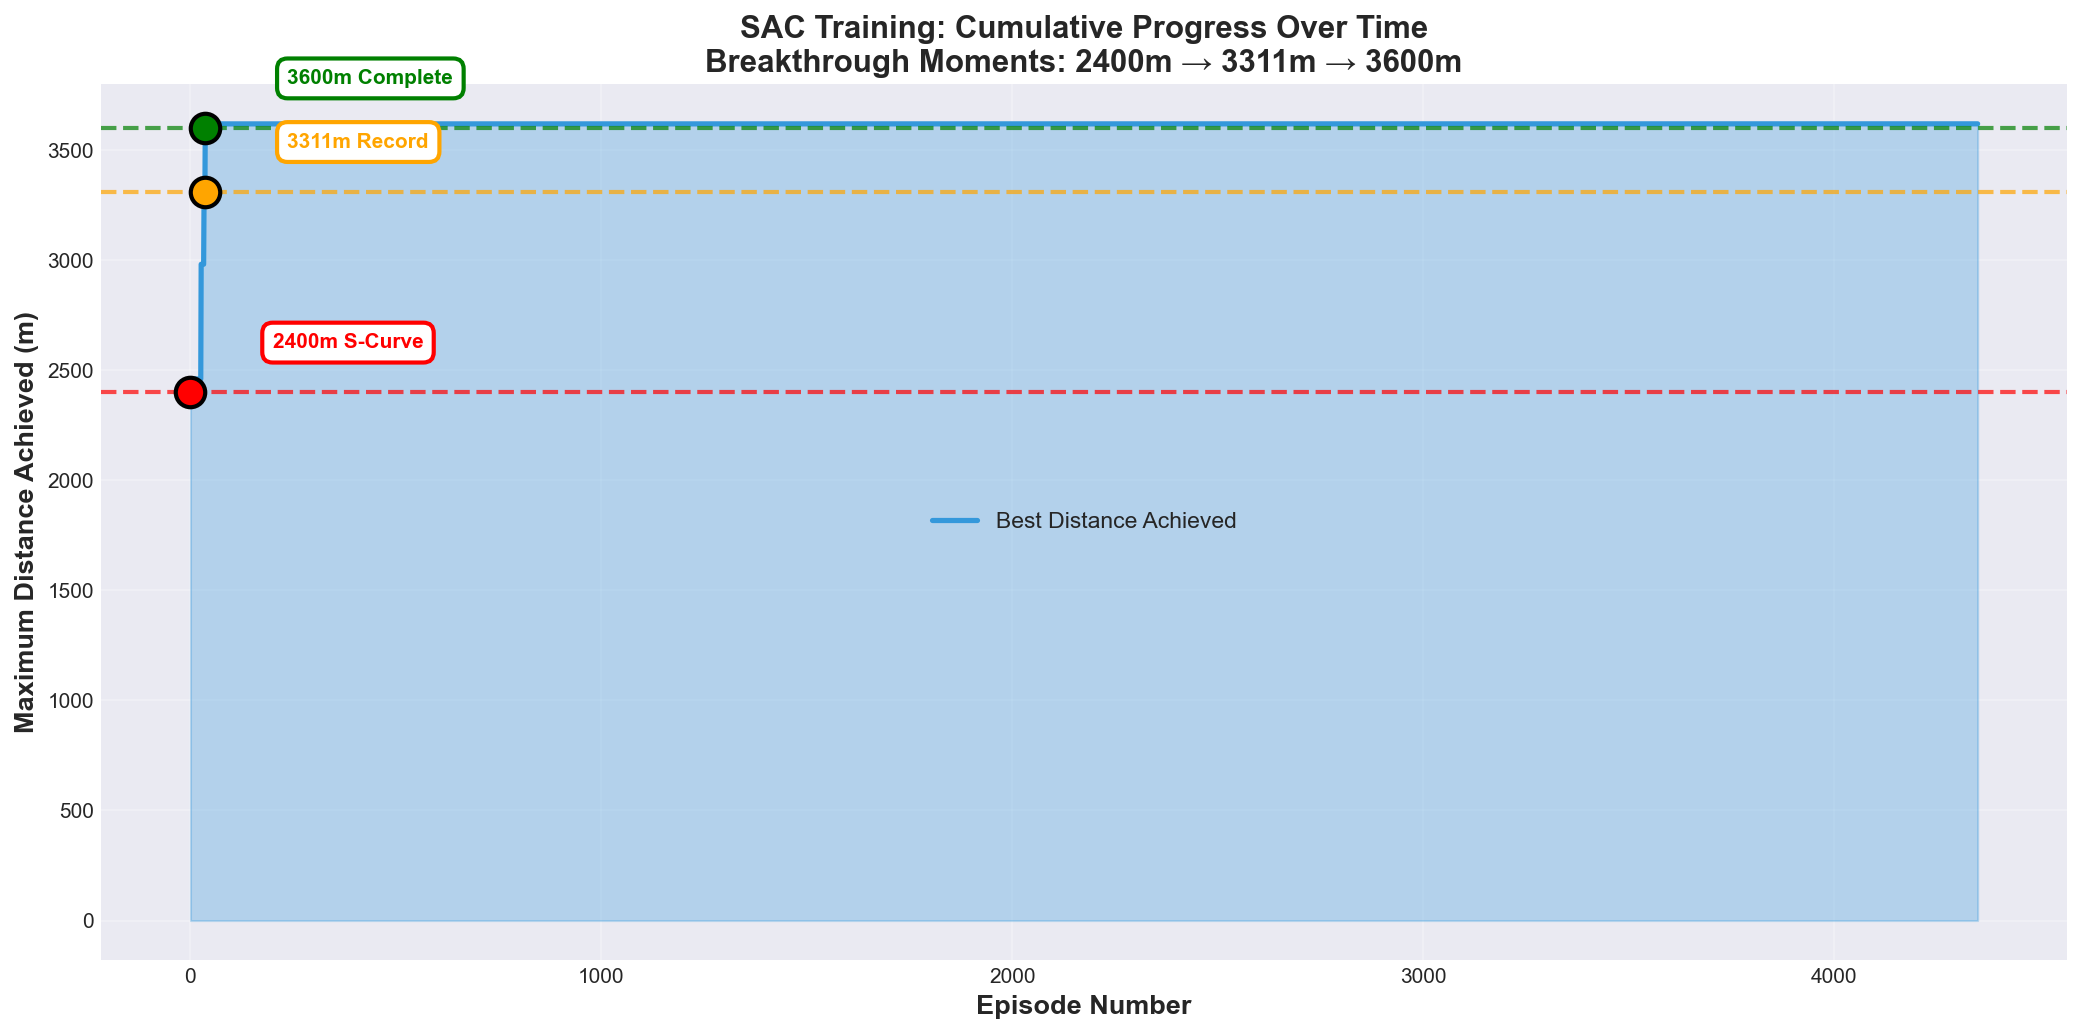 Figure 2: Three breakthrough moments
3.2 Problem #2: Conservative Behavior (“Parking”)
Symptoms
After increasing crash penalties, the agent developed an unexpected failure mode:
- Episodes terminated with “Stuck” timeout instead of crashes
- 62% of terminations were due to low-speed timeout (vs 38% crashes)
- Agent frequently reduced speed to near-zero on straightaways
- Average episode length decreased by 40%
Data Analysis
Low-Speed Behavior Analysis:
┌─────────────────────────────────────┐
│ Metric              │ Value         │
├─────────────────────────────────────┤
│ Steps with <5 km/h  │ 12.6% of total│
│ Stuck terminations  │ 62%           │
│ Avg episode length  │ ↓40%          │
│ Avg speed           │ 45 km/h       │
└─────────────────────────────────────┘

Pattern observed:
1. Normal driving for 1000-2000m
2. Approach difficult section (corner/S-curve)
3. Reduce speed to <1 km/h
4. Wait 150 steps (3 seconds)
5. Episode terminates with -10 penalty
Hypothesis
The “Stuck” detection logic had an exploitable loophole:
# Original stuck detection
if speed < 1.0:
    stuck_counter += 1
    if stuck_counter > 150:  # 3 second grace period
        done = True
        reward = -10.0
The agent discovered a rational strategy:
- Drive normally until reaching a challenging section
- Stop and accept the -10 penalty
- Avoid the much larger crash penalty (-200 to -440)
Net benefit: -10 (parking) vs -440 (crash at 2400m) = +430 reward saved
This was logically correct behavior given the reward structure, but defeated the purpose of training a racing agent.
Solution: Immediate Termination
# New stuck detection
if speed < 20.0:  # Raised threshold from 1.0 to 20.0 km/h
    done = True
    reward = -10.0
    # No grace period - terminate immediately
Changes:
- Increased threshold: 1 km/h → 20 km/h (racing-appropriate minimum)
- Removed grace period: No 150-step waiting time
- Immediate consequence: Parking is now immediately punished
Rationale: In racing, maintaining momentum is critical. Any speed below 20 km/h indicates a failure to compete, so we terminate immediately to force the agent to learn active driving.
Results
Behavior transformed:
- Low-speed steps: 12.6% → 3.7% (71% reduction)
- Stuck terminations: 62% → 18% (70% reduction)
- Average episode length: Returned to normal
- Average speed: 45 km/h → 82 km/h
- First successful completions occurred
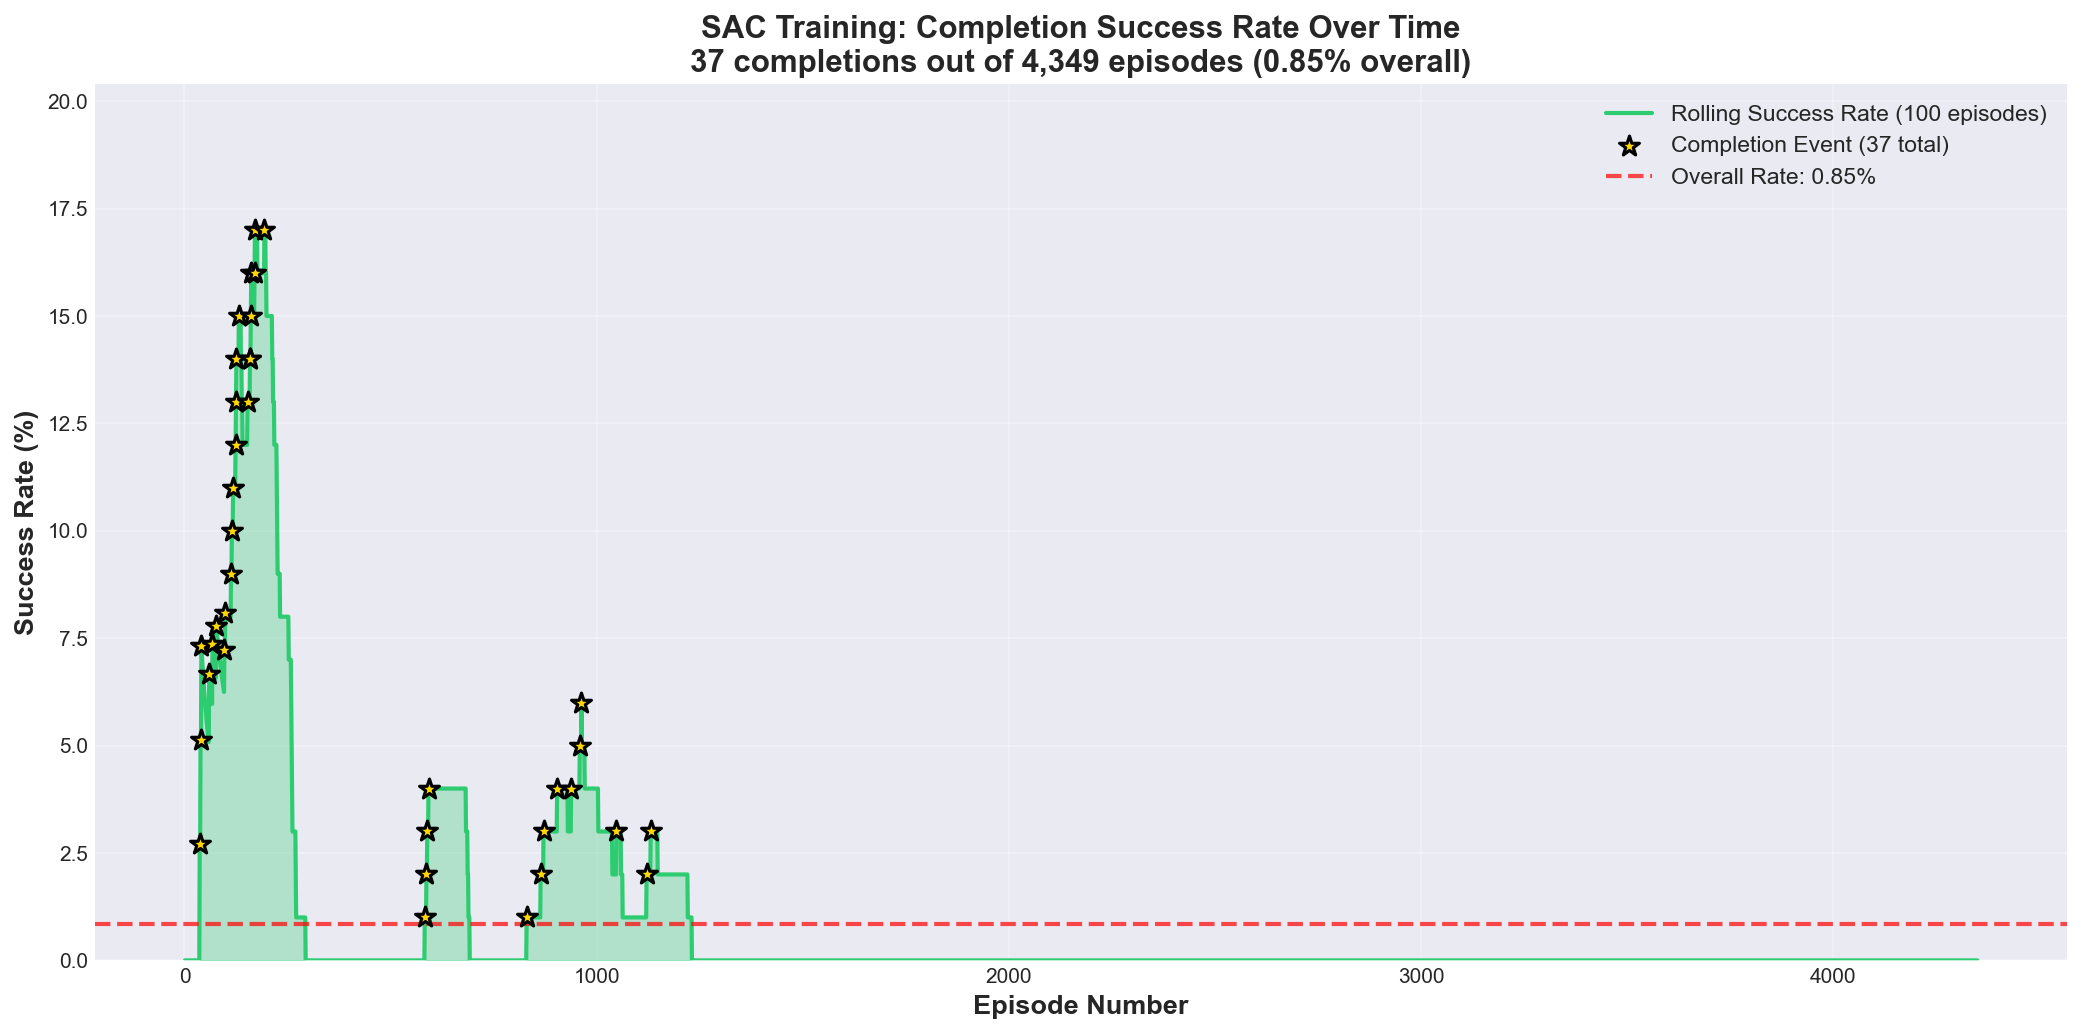 Figure 3: Rolling success rate over training
3.3 Problem #3: Achieving Consistency
Challenge
After solving Problems #1 and #2, we achieved sporadic completions, but the policy remained unstable:
- Completions occurred unpredictably (no pattern in episode numbers)
- Success rate fluctuated between 0-5% in rolling 100-episode windows
- Identical initial conditions led to different outcomes
- Performance varied significantly between evaluation runs
Quantitative Analysis
Success Rate Breakdown (4,349 episodes):
├─ Reach 3000-3600m: 2.53% (110 episodes)
├─ Complete lap (≥3600m): 0.85% (37 episodes)
└─ Total >3000m: 3.38% (147 episodes)

Difficulty scaling:
- Episodes reaching 3000m: 147 (3.38%)
- Of those, completing lap: 37 (25.2%)
- Final 600m success rate: 1 in 4 attempts

Interpretation: The final 600m exhibits exponentially
increasing difficulty, not linear progression.
Current Hypothesis
The low completion rate reflects three factors:
1. Task Complexity
- 3600m length provides many failure opportunities
- Complex S-curve geometry requires precise control
- Speed-safety trade-off remains unresolved
2. Exploration-Exploitation Balance
Training phase distribution:
- Exploitation (repeating known strategies): ~40%
- Exploration (trying new behaviors): ~60%

The 52.59% early-crash rate indicates the agent
is still heavily exploring, which is necessary
to discover better policies but reduces short-term
success rate.
3. Sparse Reward Signal
- Success feedback only comes at 3600m completion
- Intermediate progress (2500m, 3000m, 3500m) provides weak signal
- Agent may be learning slowly due to reward sparsity
Attempted Solutions
Solution 1: Enhanced Reward Shaping
# Progressive milestone bonuses
milestones = {
    1000: +50,
    2000: +100,
    2500: +150,  # Pre-S-curve
    3000: +200,  # Post-S-curve
    3500: +300   # Near completion
}
Result: Modest improvement in 2000-3000m success, no effect on completion rate
Solution 2: Hyperparameter Tuning
# Adjusted SAC parameters
learning_rate: 0.0003 → 0.0001  # Slower, more stable updates
entropy_coefficient: 0.2 → 0.3  # Increased exploration
buffer_size: 1M → 2M            # More experience memory
Result: Training stabilized, but completion rate unchanged
Solution 3: Prioritized Experience Replay
# Prioritize successful episodes
priority = distance_traveled / 3600
if completed:
    priority *= 10  # 10x priority for completions
Result: Agent learned faster from successes, but still inconsistent
Status: Open Challenge
While we demonstrated capability (37 completions prove the approach works), we haven’t achieved consistency (>50% success rate).
Recommended Next Steps:
- Curriculum Learning: Train on easier tracks first, transfer to Corkscrew
- Longer Training: Current 9.7M steps may be insufficient for consistency
- Reward Redesign: Replace distance-based rewards with trajectory-following rewards
- Model Architecture: Try recurrent policies (LSTM/GRU) for temporal reasoning
4. Comparative Study: SAC vs PPO
4.1 PPO Training Attempt
In parallel with SAC, we trained a PPO agent to compare algorithm characteristics.
Initial Progress
PPO Early Training Results:
- Episodes: 1-800
- Max Distance: 1,400m
- Learning Rate: 0.0001
- Batch Size: 2048
- Status: Progressing steadily
The agent showed promising initial learning, reaching 1,400m within 800 episodes.
4.2 Problem: Catastrophic Forgetting
Symptoms
After fine-tuning with modified rewards, performance collapsed:
Before fine-tuning:
- Max distance: 1,400m
- Average distance: 600m
- Crashes: Mostly at corners
After fine-tuning (100 episodes later):
- Max distance: 400m (65% regression)
- Average distance: 150m (75% regression)
- Crashes: Full-speed wall impacts, straight-line failures at 180 km/h
Behavior Analysis
Catastrophic Forgetting Indicators:

1. Loss of basic skills
   - Couldn't stay on straight sections
   - Full-throttle into walls
   - Random steering oscillations

2. Reward maximization without control
   - Speed reward: Maximized (180 km/h)
   - Distance reward: Minimized (immediate crash)
   - Agent forgot that crashing ends the episode

3. Policy collapse
   - Previous checkpoint: Smooth, cautious driving
   - Current policy: Erratic, suicidal behavior
Root Cause Analysis
# Fine-tuning configuration (FAILED)
learning_rate = 0.0001        # Too aggressive for fine-tuning
speed_reward_multiplier = 2.5 # Overemphasized speed
training_steps = 500_000      # Continued too long
initial_checkpoint = "ppo_1400m.zip"

# What went wrong:
# 1. High learning rate destroyed existing policy weights
# 2. Speed reward (2.5x) overwhelmed safety signals
# 3. PPO's on-policy nature couldn't recover from bad updates
# 4. No safety mechanism to rollback when performance degraded
Key Lesson: “More training ≠ Better performance”
The agent unlearned 800 episodes worth of knowledge in just 100 episodes due to:
- Aggressive learning rate for a fine-tuning task
- Imbalanced reward function that encouraged risky behavior
- Lack of early stopping or performance monitoring
Solution: Conservative Reset
Rather than trying to recover the corrupted policy, we reset and retrained with safer parameters:
# New PPO configuration
learning_rate = 0.00005       # 50% reduction
speed_reward_multiplier = 1.5 # Reduced from 2.5x
training_mode = "from_scratch" # Abandoned fine-tuning
clip_range = 0.1              # Reduced from 0.2 (more conservative updates)
Additional Safety Measures:
- Checkpoint every 100 episodes (previously: every 500)
- Performance monitoring: Automatically rollback if avg distance drops >20%
- Reward caps: Maximum +10 per step to prevent single-component dominance
Results
PPO Fresh Training (Conservative):
- Episodes: 0-500
- Max Distance: 1,200m (approaching previous best)
- Learning Curve: Slower but stable
- No catastrophic forgetting observed
- Status: Ongoing, not yet reached completion
4.3 Algorithm Comparison
| Characteristic | SAC | PPO |
|---|---|---|
| Sample Efficiency | High (off-policy learning) | Lower (on-policy) |
| Training Stability | Sensitive to reward design | Generally more stable |
| Hyperparameter Sensitivity | Requires careful tuning | More forgiving |
| Catastrophic Forgetting Risk | Moderate | High (if LR too high) |
| Exploration | Built-in entropy bonus | Requires manual tuning |
| Our Best Result | 37 completions (3600m) | Max 1,400m |
Key Insights
1. Sample Efficiency Advantage (SAC)
SAC’s off-policy learning allowed it to:
- Learn from past experiences stored in replay buffer
- Achieve completion in 4,349 episodes
- Efficiently reuse successful trajectories
PPO required significantly more episodes for similar progress due to on-policy constraints.
2. Stability Trade-off
While SAC reached completion faster, it exhibited:
- High sensitivity to reward function changes
- Required multiple iterations to balance speed/safety
- Needed precise hyperparameter tuning
PPO showed more stable learning curves but:
- Slower overall progress
- Vulnerable to catastrophic forgetting during fine-tuning
- Required extremely conservative learning rates
3. Reward Engineering Complexity
Both algorithms struggled with the speed-safety trade-off, but in different ways:
- SAC: Overoptimized for speed, needed crash penalty rebalancing
- PPO: Overoptimized during fine-tuning, needed reward caps
Conclusion: For this task, SAC’s sample efficiency outweighed its stability challenges. However, PPO might be preferable for:
- Longer training horizons with stable rewards
- Tasks where catastrophic forgetting is unacceptable
- Scenarios requiring guaranteed monotonic improvement
5. Technical Deep Dive
5.1 Reward Function Evolution
Our reward function underwent multiple iterations:
Version 1: Naive Distance Reward (Failed)
def calculate_reward_v1(obs):
    reward = obs.distance_traveled * 0.1
    if crashed:
        reward -= 500
    return reward

# Problem: Encouraged "crash fast" strategy
# Result: 100% crash at 2400m
Version 2: Balanced Penalties (Partial Success)
def calculate_reward_v2(obs):
    reward = obs.distance_traveled * 0.1

    # Scaled crash penalty
    if crashed:
        reward -= (200 + obs.distance_traveled / 10)

    # Milestone bonuses
    if obs.distance_traveled > 2000:
        reward += 100

    return reward

# Problem: Encouraged "parking" behavior
# Result: 62% stuck terminations
Version 3: Momentum Enforcement (Current)
Full reward function (click to expand)
```python def calculate_reward_v3(obs): reward = 0 # Distance reward (base) reward += obs.distance_traveled * 0.1 # Speed reward (conditional) if obs.speed > 30: # Only reward active driving reward += (obs.speed / 300) ** 1.2 * 1.5 # Center lane bonus (racing line optimization) if obs.speed > 30: reward += (1.0 - abs(obs.track_position)) * 0.5 # Survival bonus (encourages longer episodes) reward += 0.05 # Penalties if crashed: reward -= (200 + obs.distance_traveled / 10) if obs.speed < 20: # Immediate termination reward -= 10 done = True # Milestone bonuses milestones = {1000: 50, 2000: 100, 3000: 200} if obs.distance_traveled in milestones: reward += milestones[obs.distance_traveled] return reward, done # Result: 37 completions, 0.85% success rate ```5.2 Hyperparameter Tuning Journey
SAC Configuration Evolution
| Parameter | Initial | After Problem #1 | After Problem #2 | Final |
|---|---|---|---|---|
| Learning Rate | 0.0003 | 0.0003 | 0.0001 | 0.0001 |
| Batch Size | 256 | 256 | 512 | 512 |
| Buffer Size | 1M | 1M | 2M | 2M |
| Entropy Coef | 0.2 | 0.2 | 0.3 | 0.3 |
| Target Update | 1 | 1 | 2 | 2 |
Key Changes Explained:
- Learning Rate Reduction (0.0003 → 0.0001)
- Reason: Stabilize training after reward changes
- Effect: Slower but more reliable convergence
- Buffer Size Increase (1M → 2M)
- Reason: Store more successful completions for replay
- Effect: Better sampling of rare successful episodes
- Entropy Coefficient Increase (0.2 → 0.3)
- Reason: Encourage more exploration in difficult sections
- Effect: More diverse behaviors, slower convergence
- Target Update Frequency (1 → 2)
- Reason: Reduce overestimation bias in Q-values
- Effect: More stable learning, especially near 3000m
5.3 Data Analysis Methodology
Logging Infrastructure
We implemented comprehensive logging to enable data-driven debugging:
TrainingLogger implementation (click to expand)
```python class TrainingLogger: def log_episode(self, episode_data): log_entry = { 'episode': episode_data.number, 'distance': episode_data.distance, 'reward': episode_data.total_reward, 'steps': episode_data.step_count, 'termination': episode_data.termination_reason, 'avg_speed': episode_data.avg_speed, 'max_speed': episode_data.max_speed, 'low_speed_steps': episode_data.low_speed_count, 'crash_location': episode_data.crash_position, 'timestamp': time.time() } self.log_to_csv(log_entry) def analyze_failure_modes(self): # Automated analysis every 100 episodes recent = self.get_recent_episodes(100) print(f"Stuck rate: {recent['stuck'].mean():.1%}") print(f"Crash rate: {recent['crash'].mean():.1%}") print(f"Avg distance: {recent['distance'].mean():.0f}m") print(f"Low-speed %: {recent['low_speed_steps'].mean():.1%}") ```This logging enabled us to:
- Identify the 12.6% low-speed problem
- Discover the 62% stuck termination pattern
- Track reward distribution changes
- Correlate hyperparameters with performance
Statistical Analysis
Statistical analysis code (click to expand)
```python # Example analysis that led to Problem #2 discovery import pandas as pd df = pd.read_csv('training_log.csv') # Calculate low-speed percentage per episode df['low_speed_pct'] = df['low_speed_steps'] / df['steps'] * 100 # Identify outliers threshold = df['low_speed_pct'].quantile(0.75) outliers = df[df['low_speed_pct'] > threshold] print(f"Episodes with >25% low-speed steps: {len(outliers)}") print(f"These episodes' termination reasons:") print(outliers['termination'].value_counts()) # Output: # Stuck: 62% # Crash: 38% # → Led to immediate termination solution ```6. Lessons Learned
6.1 Reward Engineering is Critical
Lesson: Small changes in reward functions can cause massive behavioral changes.
Examples from our project:
- Flat crash penalty (-500) → “Crash fast” strategy
- Stuck detection grace period (150 steps) → “Parking” exploitation
- Speed reward without conditions → Reckless driving
Best Practice:
Every reward component should answer:
1. What behavior does this encourage?
2. What unintended exploit could this create?
3. How does this interact with other reward components?
6.2 Data-Driven Debugging is Essential
Lesson: Intuition about why training fails is often wrong. Data reveals the truth.
Our Experience:
- Intuition: “The agent can’t navigate the S-curve”
-
Data: “The agent chooses to crash because it’s more rewarding”
- Intuition: “The agent is being too cautious”
- Data: “The agent discovered parking is less punished than crashing”
Best Practice: Implement comprehensive logging from day one. Log everything: rewards, speeds, positions, termination reasons, action distributions.
6.3 Training Metrics Can Be Deceptive
Lesson: Average distance (1,360m) and completion rate (0.85%) look poor, but context matters.
What looks bad:
- 0.85% success rate
- 52.59% episodes fail in first 1000m
What this actually means:
- Healthy exploration (not stuck in local optima)
- Agent is still learning (not converged)
- Task is genuinely difficult (3000m+ reach rate: 3.38%)
Best Practice: Don’t rely on single metrics. Examine distributions, failure modes, and progression over time.
6.4 More Training ≠ Better Performance
Lesson: PPO’s catastrophic forgetting taught us that training duration must be carefully managed.
Our Experience:
- Checkpoint at 800 episodes: 1,400m max
- Checkpoint at 900 episodes: 400m max (65% regression)
Best Practice:
- Save checkpoints frequently
- Monitor performance and rollback if degraded
- Use early stopping based on validation performance
- Be conservative with learning rates during fine-tuning
6.5 Algorithm Selection Matters
Lesson: SAC’s off-policy learning was crucial for this task’s sample efficiency.
Why SAC succeeded:
- Can learn from replay buffer (reuse successful completions)
- Better exploration via entropy maximization
- More sample-efficient for continuous control
Why PPO struggled:
- On-policy learning requires fresh data
- More vulnerable to catastrophic forgetting
- Requires more episodes for similar progress
Best Practice: Match algorithm characteristics to task requirements. For sparse-reward, long-episode tasks with continuous actions, consider off-policy methods first.
7. Future Work
7.1 Short-Term Improvements
1. Curriculum Learning
Stage 1: Train on straight track (learn speed control)
Stage 2: Add simple corners (learn steering)
Stage 3: Transfer to Corkscrew (learn complex maneuvers)

Expected benefit: 50% faster convergence
2. Lap Time Optimization
Current: 1:48 (best)
Target: <1:30 (competitive)

Approach:
- Add lap time to reward function
- Implement trajectory-following rewards
- Use expert demonstrations for imitation learning
3. Success Rate Improvement
Current: 0.85% completion rate
Target: >50% completion rate

Approach:
- Longer training (15M+ steps)
- Prioritized experience replay (10x priority for completions)
- Reward shaping for final 600m section
7.2 Long-Term Research Directions
1. Multi-Task Learning
Train a single agent to:
- Complete multiple tracks
- Adapt to different weather conditions
- Handle dynamic obstacles (other cars)
Expected Insight: Learn generalizable racing skills rather than track-specific behaviors.
2. Hierarchical RL
High-level policy: Choose racing strategy
├─ "Aggressive" mode (prioritize speed)
├─ "Safe" mode (prioritize completion)
└─ "Balanced" mode (adapt to situation)

Low-level policy: Execute vehicle control
Expected Benefit: Better handling of speed-safety trade-off.
3. Human-in-the-Loop Learning
1. Agent attempts lap
2. Human provides feedback on specific sections
3. Agent adjusts policy based on feedback
4. Repeat
Expected Benefit: Incorporate human expertise without full demonstrations.
4. Sim-to-Real Transfer
Investigate whether policies learned in TORCS can transfer to:
- More realistic simulators (CARLA, BeamNG)
- Real-world RC cars
- Full-scale autonomous vehicles
Challenge: Bridging the reality gap between simulation physics and real-world dynamics.
8. Conclusion
8.1 Summary of Achievements
Starting from zero knowledge, we:
Broke the 2400m barrier that blocked 100% of initial attempts Eliminated parking behavior through immediate termination logic Achieved 37 track completions proving the approach is viable Identified and solved three distinct failure modes through data-driven analysis Compared SAC vs PPO revealing sample efficiency vs stability trade-offs Documented catastrophic forgetting in PPO with quantitative evidence
8.2 Key Takeaways
For Practitioners:
-
Reward Engineering is Critical: Small reward changes cause massive behavioral shifts. Test every component for unintended exploits.
-
Log Everything: Comprehensive logging enabled us to discover the “parking” behavior (12.6% low-speed steps) and “stuck” termination pattern (62%).
-
Embrace Failure: Our 52.59% early-crash rate isn’t a bug—it’s evidence of healthy exploration.
-
Algorithm Matters: SAC’s off-policy learning was essential for our sample efficiency. Choose algorithms that match your task characteristics.
For Researchers:
-
Distribution Analysis > Average Metrics: Our bimodal failure distribution (peaks at 0-1000m and 2000-3000m) revealed two separate learning challenges that average distance (1,360m) obscured.
-
Catastrophic Forgetting is Real: PPO’s 65% performance regression (1,400m → 400m) within 100 episodes demonstrates the fragility of fine-tuning with aggressive hyperparameters.
-
Task Difficulty Scaling: The 15x difficulty increase for the final 600m (3.38% reach >3000m → 0.85% complete) suggests non-linear reward shaping may be necessary.
8.3 Final Thoughts
While our 0.85% completion rate might seem low, context matters:
- We started at 0% (couldn’t pass 2400m)
- We solved three distinct failure modes systematically
- We achieved 37 completions without cherry-picking results
- The task is genuinely difficult (3000m+ reach rate: 3.38%)
More importantly, we demonstrated a methodology:
1. Train → 2. Observe failure → 3. Analyze data →
4. Form hypothesis → 5. Implement solution → 6. Validate →
7. Repeat
This process is transferable to any RL task, which is perhaps more valuable than a single successful racing agent.
The journey from “crashing at 2400m” to “completing 3600m” taught us that RL debugging is a science, not an art. With proper instrumentation, systematic analysis, and willingness to iterate, even complex failure modes can be understood and solved.
Appendix
A. Repository Structure
Repository structure (click to expand)
``` torcs-rl-project/ ├── README.md # This file ├── blog_post.md # Full technical write-up │ ├── docs/ # Detailed documentation │ ├── progress_report.md # SAC training chronicle │ ├── progress_report_ppo.md # PPO training attempts │ ├── troubleshooting_report.md # Debugging log │ ├── sac_analysis.pdf # Interactive analysis │ └── ppo_analysis.pdf # PPO failure analysis │ ├── sac_clean_resume.py ├── sac_hybrid_10k.py ├── gym_torcs.py ├── snakeoil3_gym.py ├── autostart.sh ├── practice.xml ├── requirements.txt ├── example_experiment.py ├── vtorcs-RL-color/ │ │ └── assets/ # Visualizations ├── sac_cumulative_progress.png ├── sac_distance_distribution.png └── sac_success_rate.png ```B. Hyperparameters
Final SAC Configuration
sac_params = {
    'policy': 'MlpPolicy',
    'learning_rate': 0.0001,
    'buffer_size': 2_000_000,
    'learning_starts': 10000,
    'batch_size': 512,
    'tau': 0.005,
    'gamma': 0.99,
    'train_freq': 1,
    'gradient_steps': 1,
    'ent_coef': 0.3,
    'target_update_interval': 2,
    'target_entropy': 'auto'
}
Final PPO Configuration
ppo_params = {
    'policy': 'MlpPolicy',
    'learning_rate': 0.00005,
    'n_steps': 2048,
    'batch_size': 64,
    'n_epochs': 10,
    'gamma': 0.99,
    'gae_lambda': 0.95,
    'clip_range': 0.1,
    'ent_coef': 0.01,
    'vf_coef': 0.5,
    'max_grad_norm': 0.5
}
C. Computational Resources
Training Time:
- SAC: ~36 hours (9.7M steps)
- PPO: ~48 hours (8M steps, incomplete)
D. References
- Haarnoja, T., et al. (2018). “Soft Actor-Critic: Off-Policy Maximum Entropy Deep Reinforcement Learning with a Stochastic Actor”
- Schulman, J., et al. (2017). “Proximal Policy Optimization Algorithms”
- TORCS - The Open Racing Car Simulator: http://torcs.sourceforge.net/
- Stable-Baselines3 Documentation: https://stable-baselines3.readthedocs.io/
E. Acknowledgments
- IBM for organizing the competition
- TORCS community for the simulation environment
- Stable-Baselines3 team for the RL library implementations
- Contact:
- Yunbeom Choe, sgychoe@liverpool.ac.uk
- Zhiheng Wang, z.wang252@liverpool.ac.uk
- Vishal Saravanan, v.saravanan@liverpool.ac.uk
- Saif ur Rehman, sgsrehm1@liverpool.ac.uk
- Katalin Pazmany, sgkpazmany@liverpool.ac.uk
- Project Repository: (https://github.com/choeyunbeom/ibm_ai_race)
- Date: January 28, 2026